devops-bootcamp-project
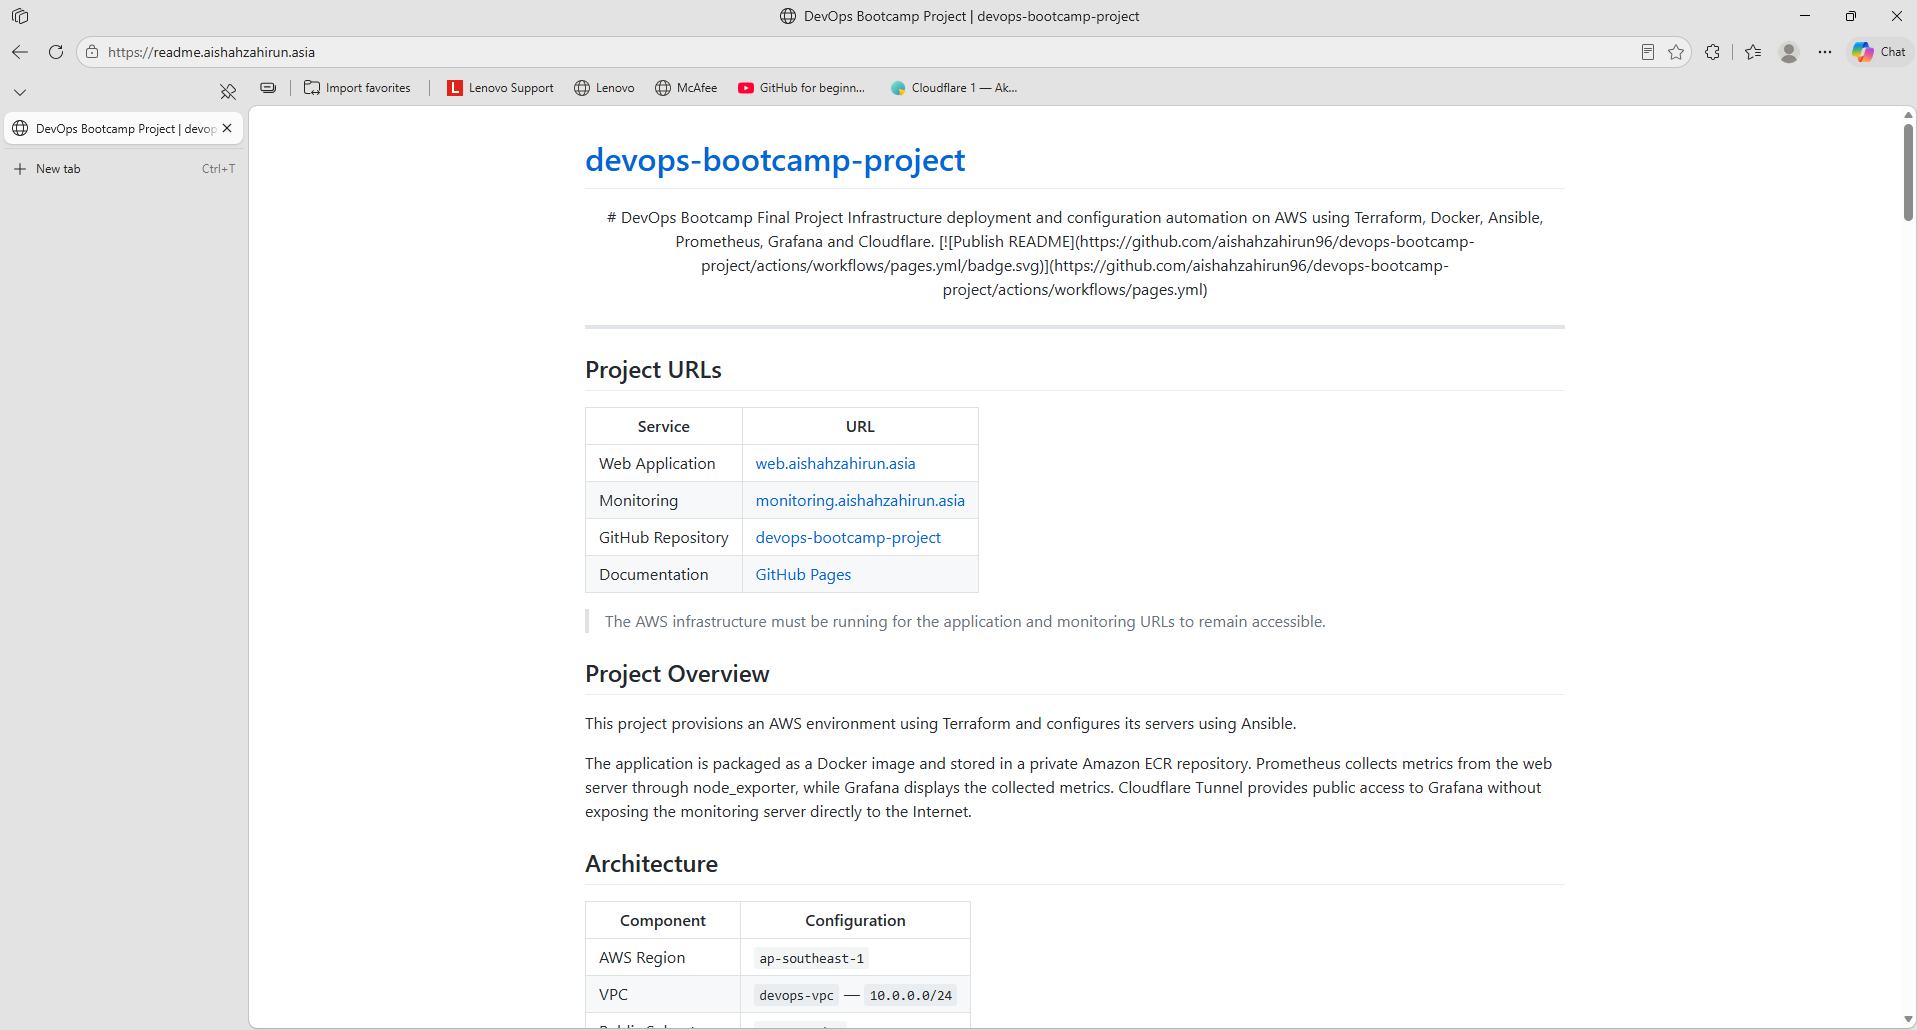
Project URLs
| Service | URL |
|---|---|
| Web Application | web.aishahzahirun.asia |
| Monitoring | monitoring.aishahzahirun.asia |
| GitHub Repository | devops-bootcamp-project |
| Documentation | README.md |
The AWS infrastructure must be running for the application and monitoring URLs to remain accessible.
Project Overview
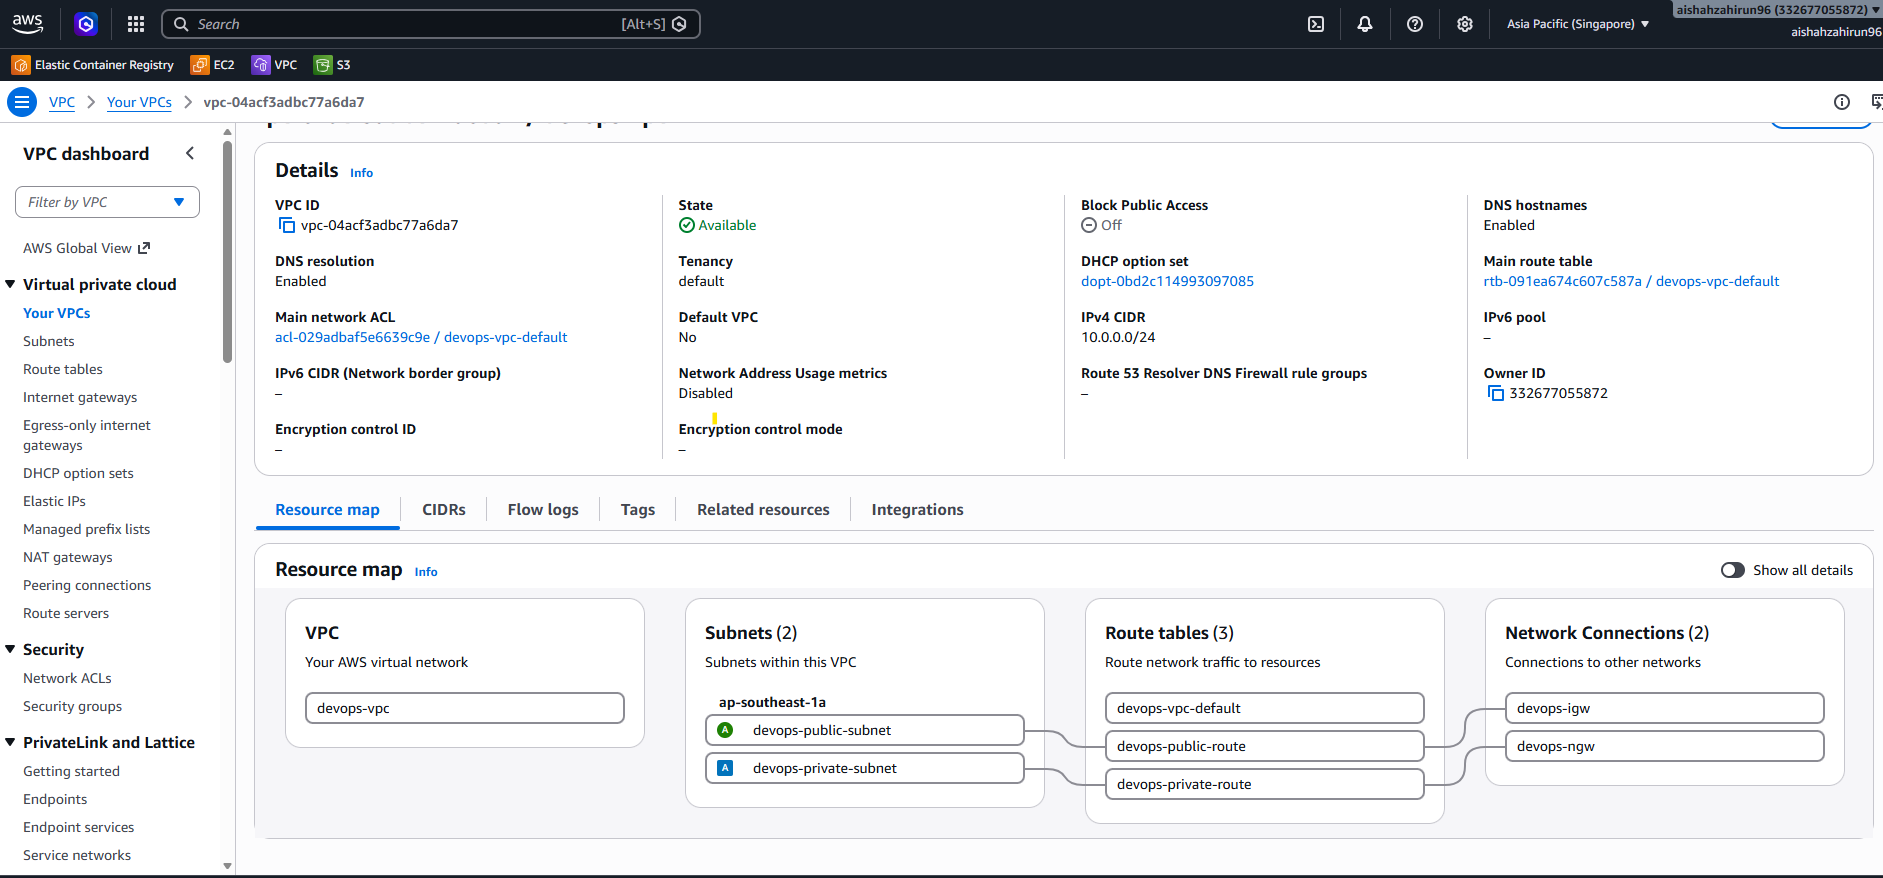
This project provisions an AWS environment using Terraform and configures its servers using Ansible.
The application is packaged as a Docker image and stored in a private Amazon ECR repository. Prometheus collects metrics from the web server through node_exporter, while Grafana displays the collected metrics. Cloudflare Tunnel provides public access to Grafana without exposing the monitoring server directly to the Internet.
Architecture
| Component | Configuration |
|---|---|
| AWS Region | ap-southeast-1 |
| VPC | devops-vpc — 10.0.0.0/24 |
| Public Subnet | 10.0.0.0/25 |
| Private Subnet | 10.0.0.128/25 |
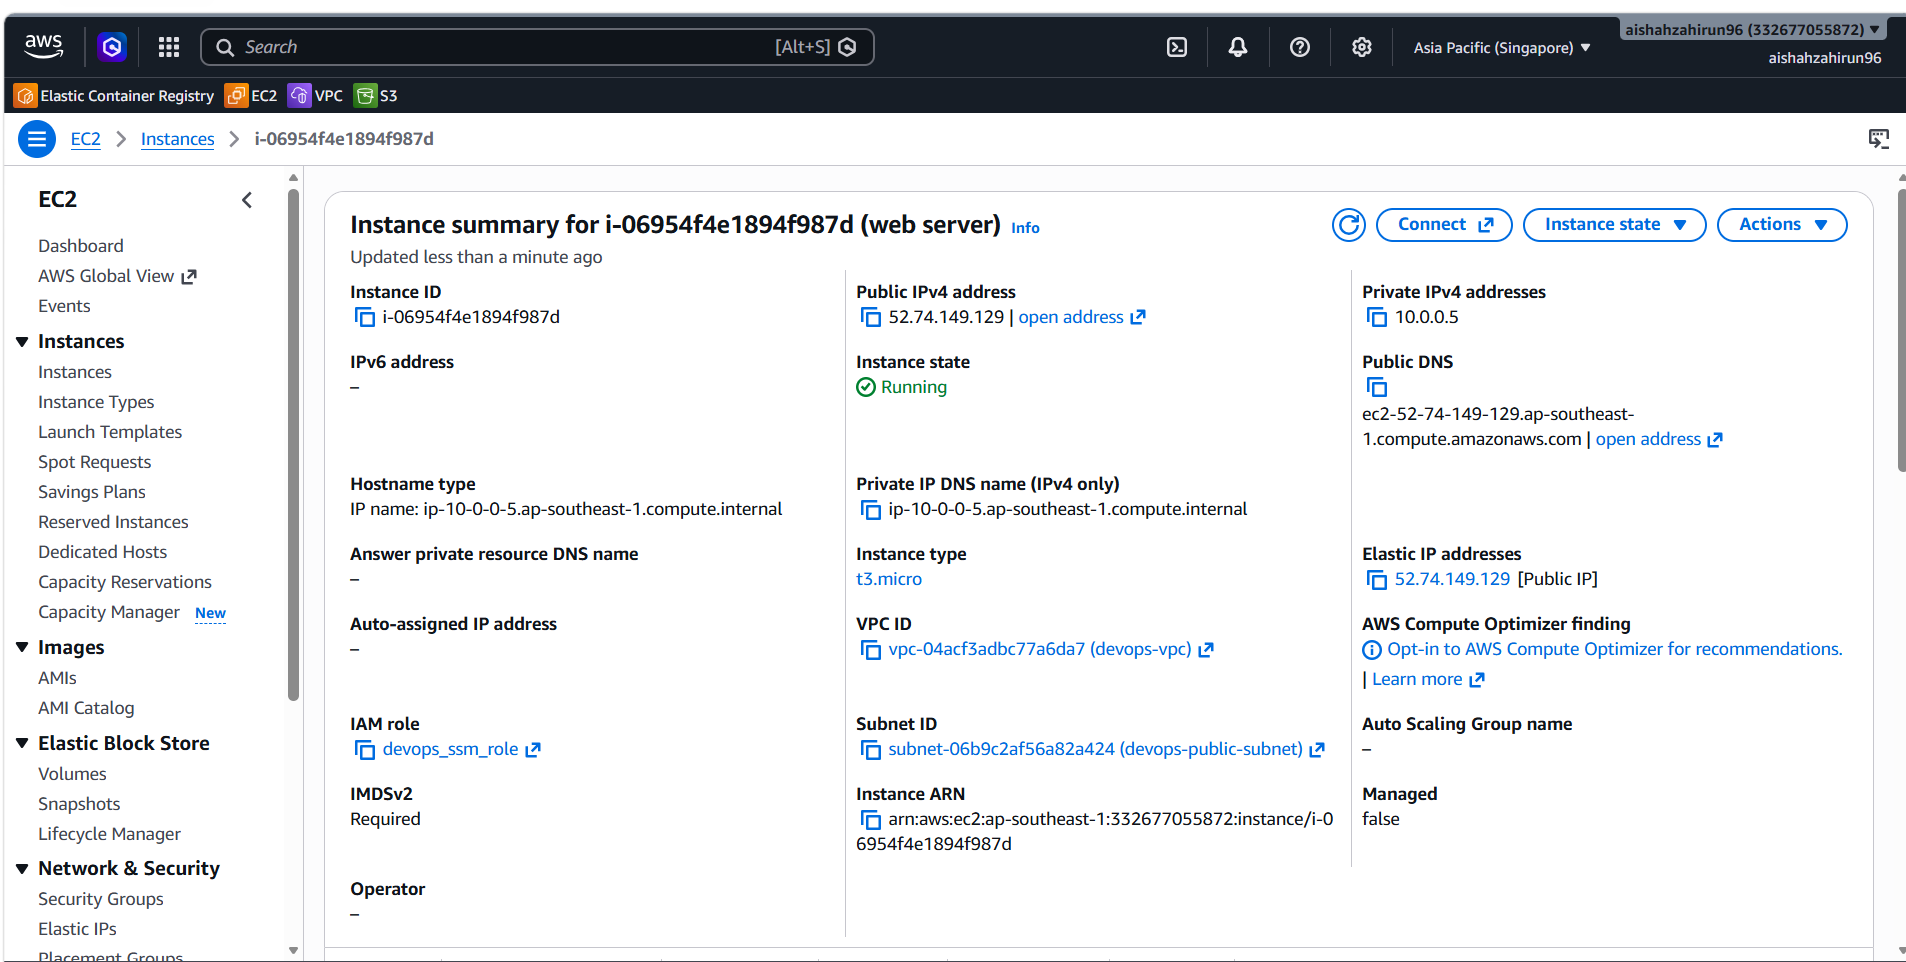
| Web Server | 10.0.0.5 |
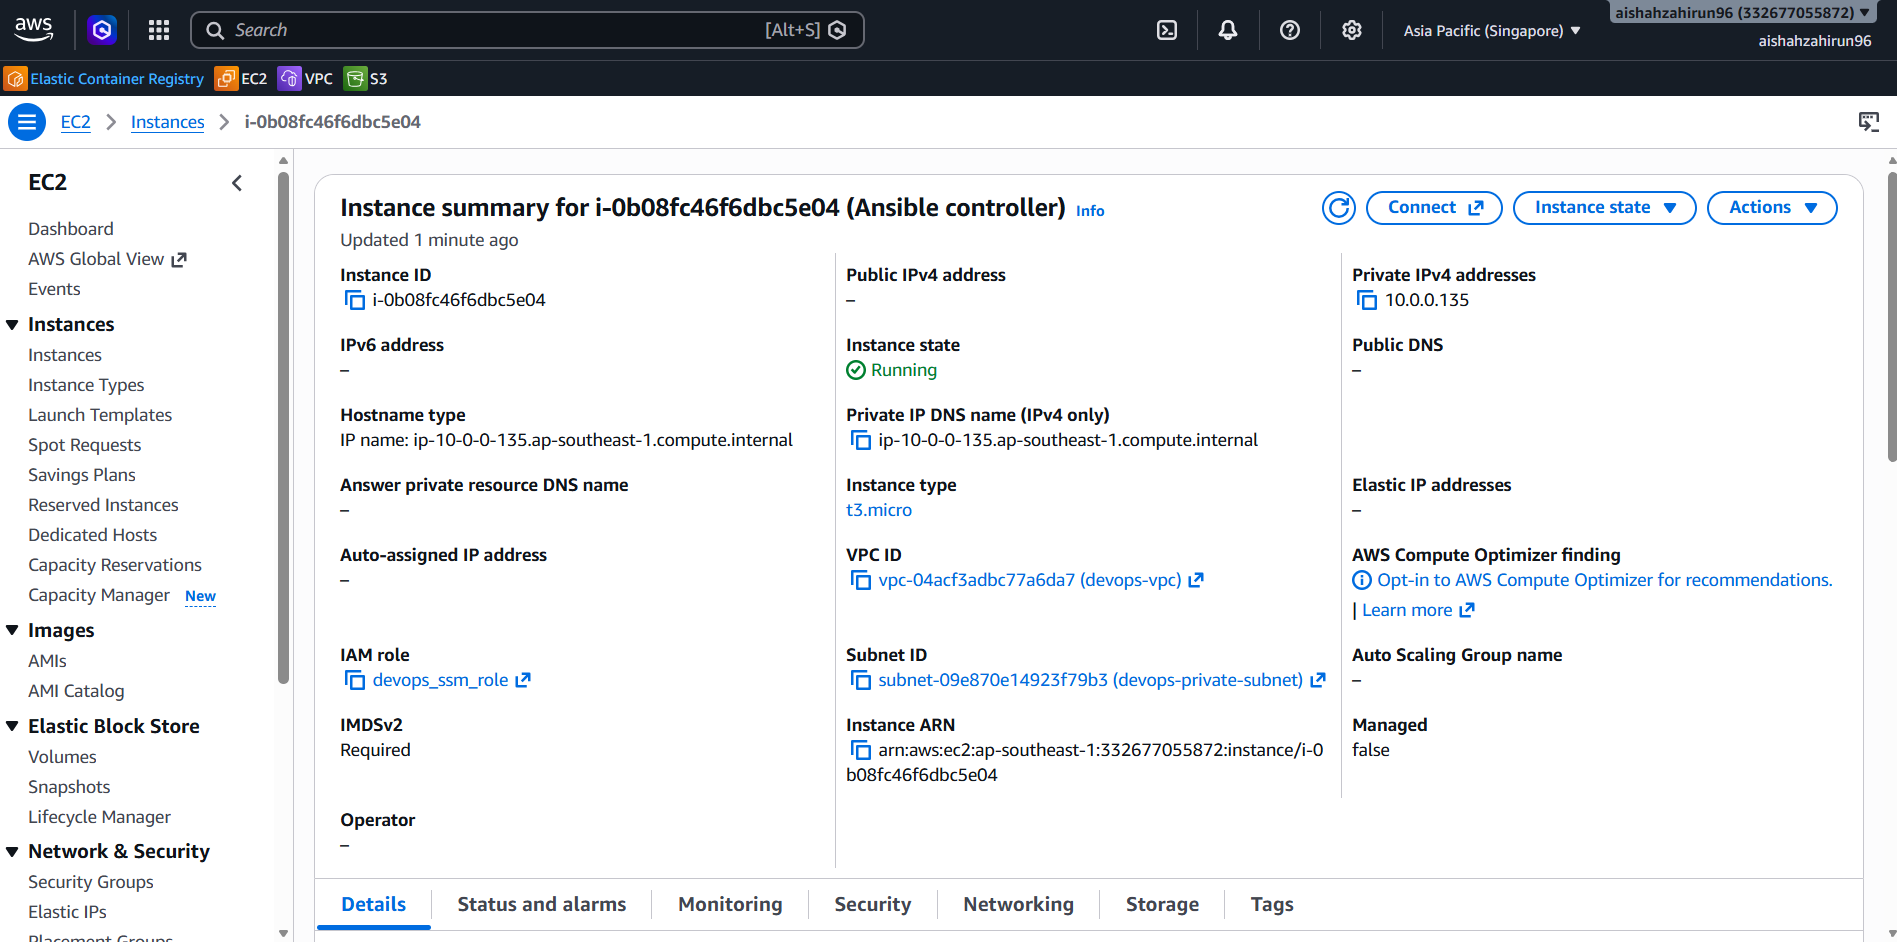
| Ansible Controller | 10.0.0.135 |
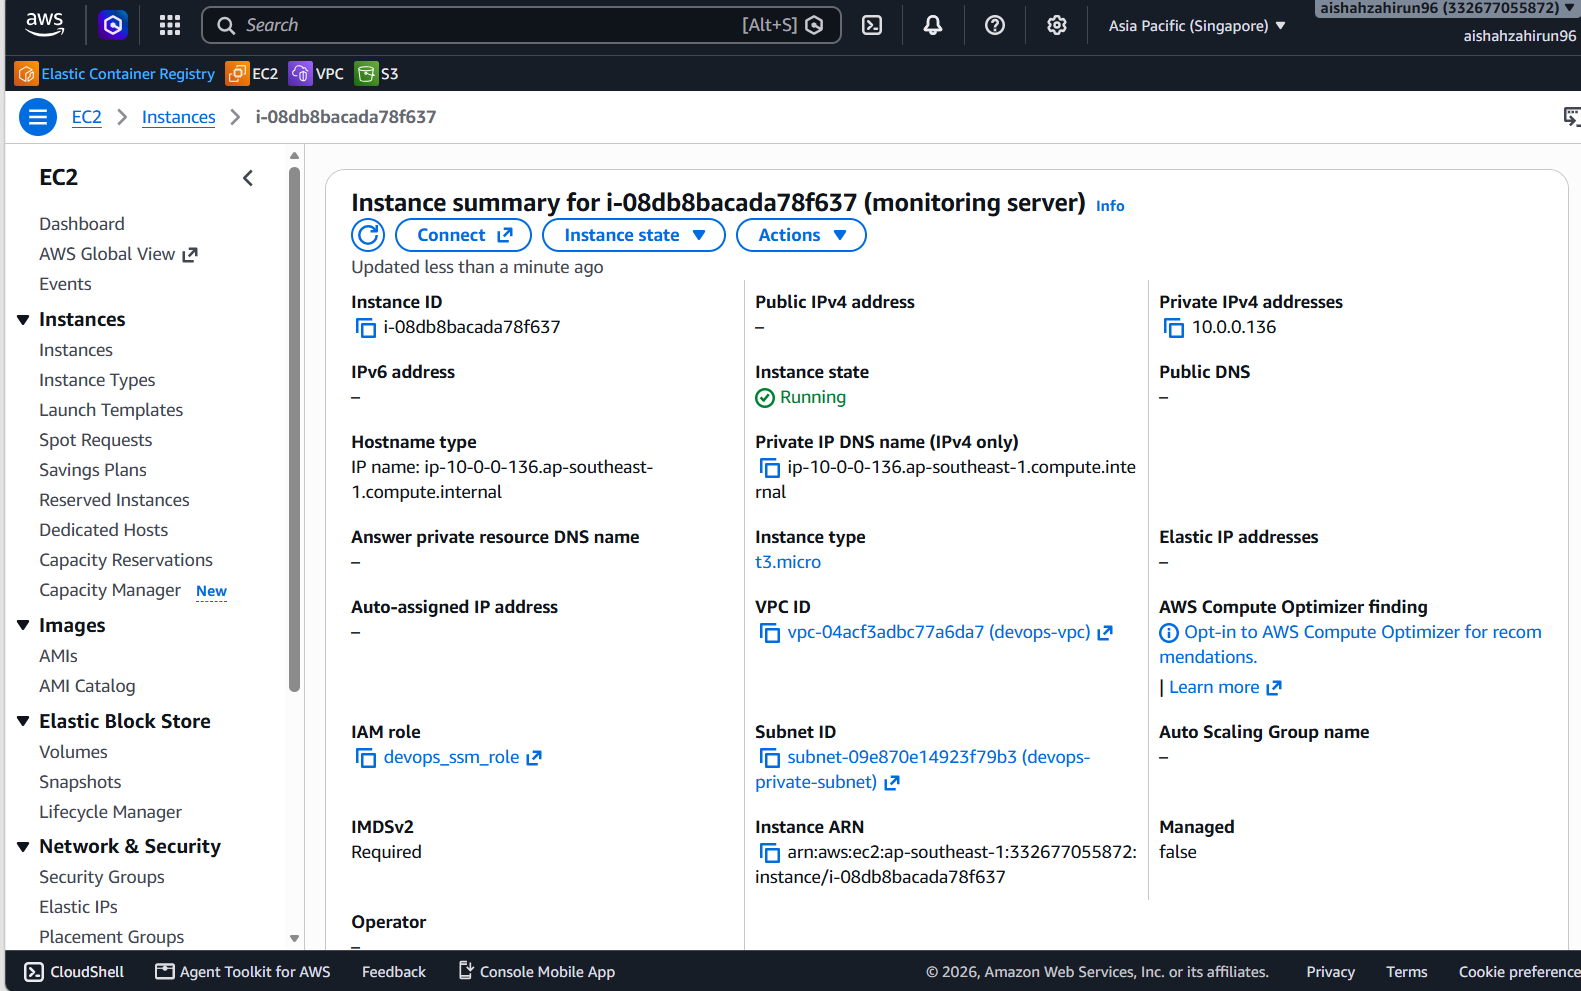
| Monitoring Server | 10.0.0.136 |
Server Roles
| Server | Network | Role |
|---|---|---|
| Web Server | Public subnet | Runs the application container and node_exporter |
| Ansible Controller | Private subnet | Runs Ansible playbooks |
| Monitoring Server | Private subnet | Runs Prometheus and Grafana containers |
Traffic Flow
Internet
   │
   ├── web.aishahzahirun.asia
   │       │
   │       ▼
   │   Elastic IP
   │       │
   │       ▼
   │   Web Server :80
   │
   └── monitoring.aishahzahirun.asia
           │
           ▼
      Cloudflare Tunnel
           │
           ▼
       Grafana :3000

Web Server node_exporter :9100
           │
           ▼
Prometheus :9090 → Grafana
Repository Structure
.
├── app/
│   ├── ship/
│   ├── Dockerfile
│   ├── .dockerignore
│   └── nginx.conf
├── terraform/
│   ├── providers.tf
│   ├── network.tf
│   ├── security.tf
│   ├── iam.tf
│   ├── ec2.tf
│   └── outputs.tf
├── ansible/
│   ├── ansible.cfg
│   ├── inventory.ini
│   ├── requirements.yaml
│   ├── site.yaml
│   └── tasks/
│   │   ├── install-docker.yaml
│   │   ├── deploy-app.yaml
│   │   └──  deploy-monitoring.yaml
│   └── files/
│       ├── compose.yml
│       └── prometheus.yaml
├── docs/
│   └── screenshots/
├── .github/
│   └── workflows/
│       └── pages.yml
└── README.md
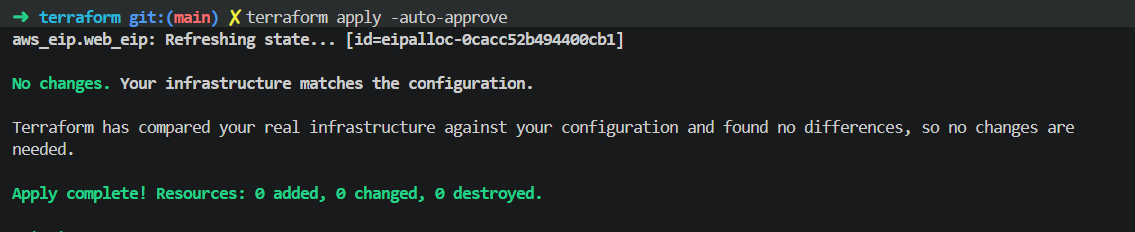
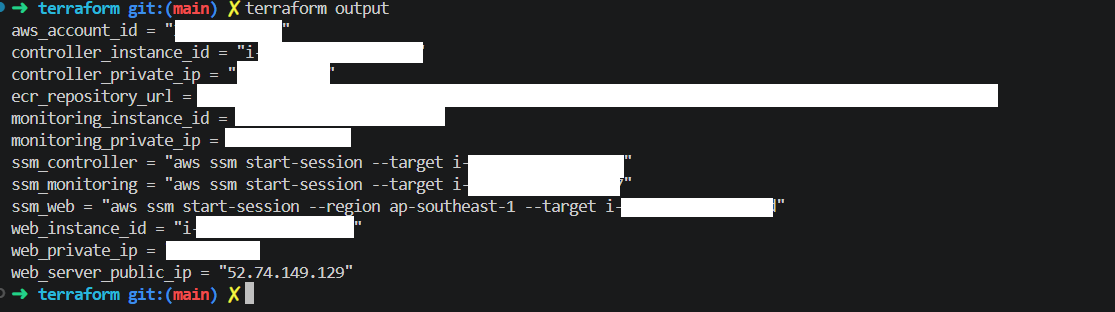
1. Infrastructure with Terraform
Terraform provisions:
- One VPC
- One public subnet
- One private subnet
- Internet Gateway
- NAT Gateway
- Public and private route tables
- Public and private security groups
- Three EC2 instances
- Elastic IP for the web server
- IAM instance profiles for AWS Systems Manager
- Private Amazon ECR repository
The Terraform state is stored in the manually created S3 bucket:
devops-bootcamp-terraform-aishah
Terraform Commands
cd terraform
terraform init
terraform fmt
terraform validate
terraform plan
terraform apply
Infrastructure Evidence
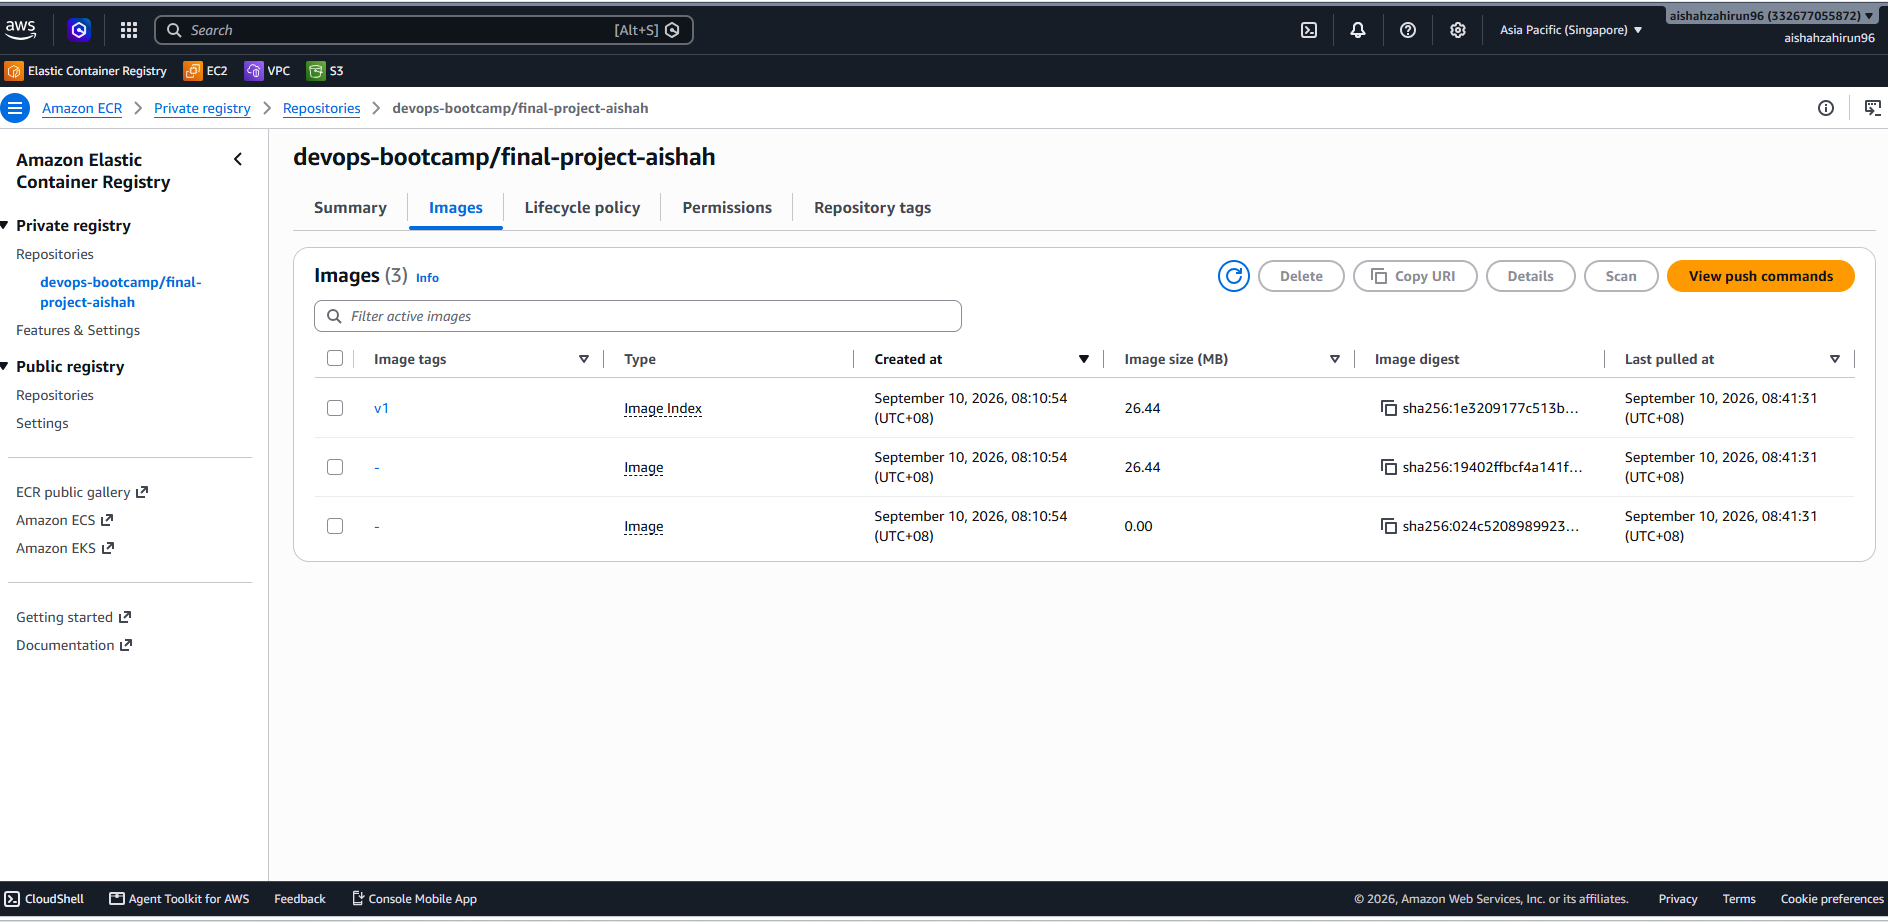
2. Docker and Amazon ECR
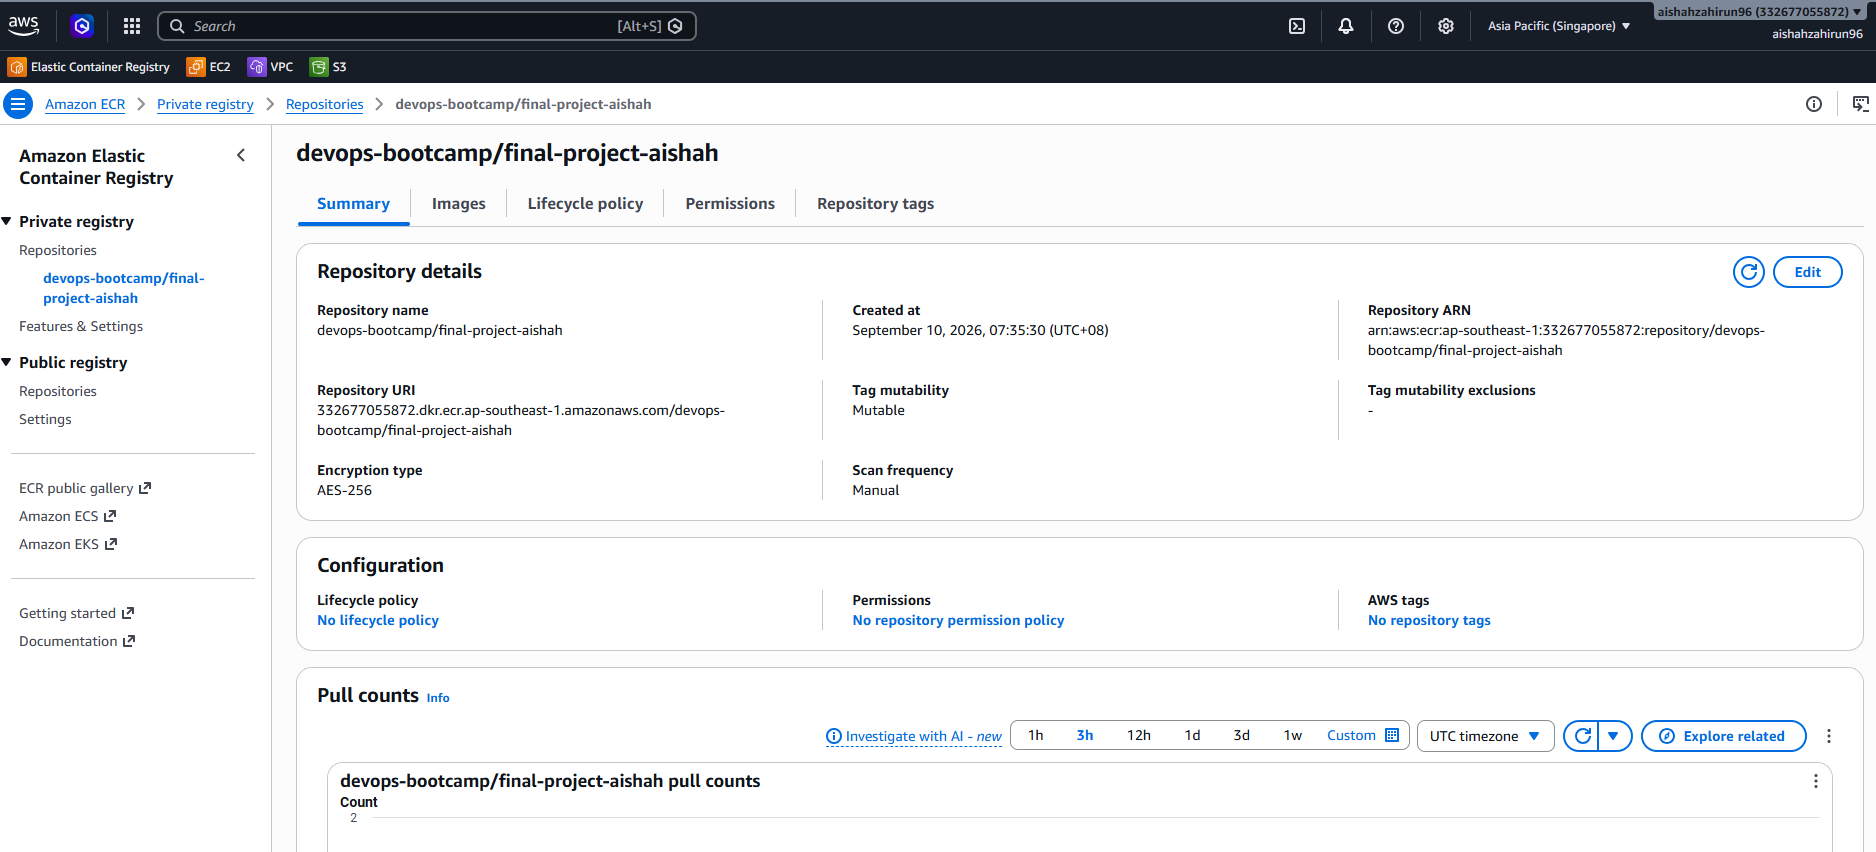
The application uses a multi-stage Docker build:
- Node.js builds the Vite application.
- Nginx serves the generated static files.
- The image is pushed to the private ECR repository.
ECR repository:
devops-bootcamp/final-project-aishah
Build the Image
export AWS_REGION=ap-southeast-1

ECR_REPO=$(terraform -chdir=terraform output -raw ecr_repository_url)
ECR_REGISTRY="${ECR_REPO%%/*}"
IMAGE_TAG=v1

aws ecr get-login-password --region "$AWS_REGION" |
  docker login \
    --username AWS \
    --password-stdin "$ECR_REGISTRY"

docker buildx build \
  --platform linux/amd64 \
  --load \
  -t "$ECR_REPO:$IMAGE_TAG" \
  ./app
Test Locally
docker run --rm -d \
  --name bootcamp-preview \
  -p 8080:80 \
  "$ECR_REPO:$IMAGE_TAG"

curl --fail http://localhost:8080/
Push to ECR
docker push "$ECR_REPO:$IMAGE_TAG"
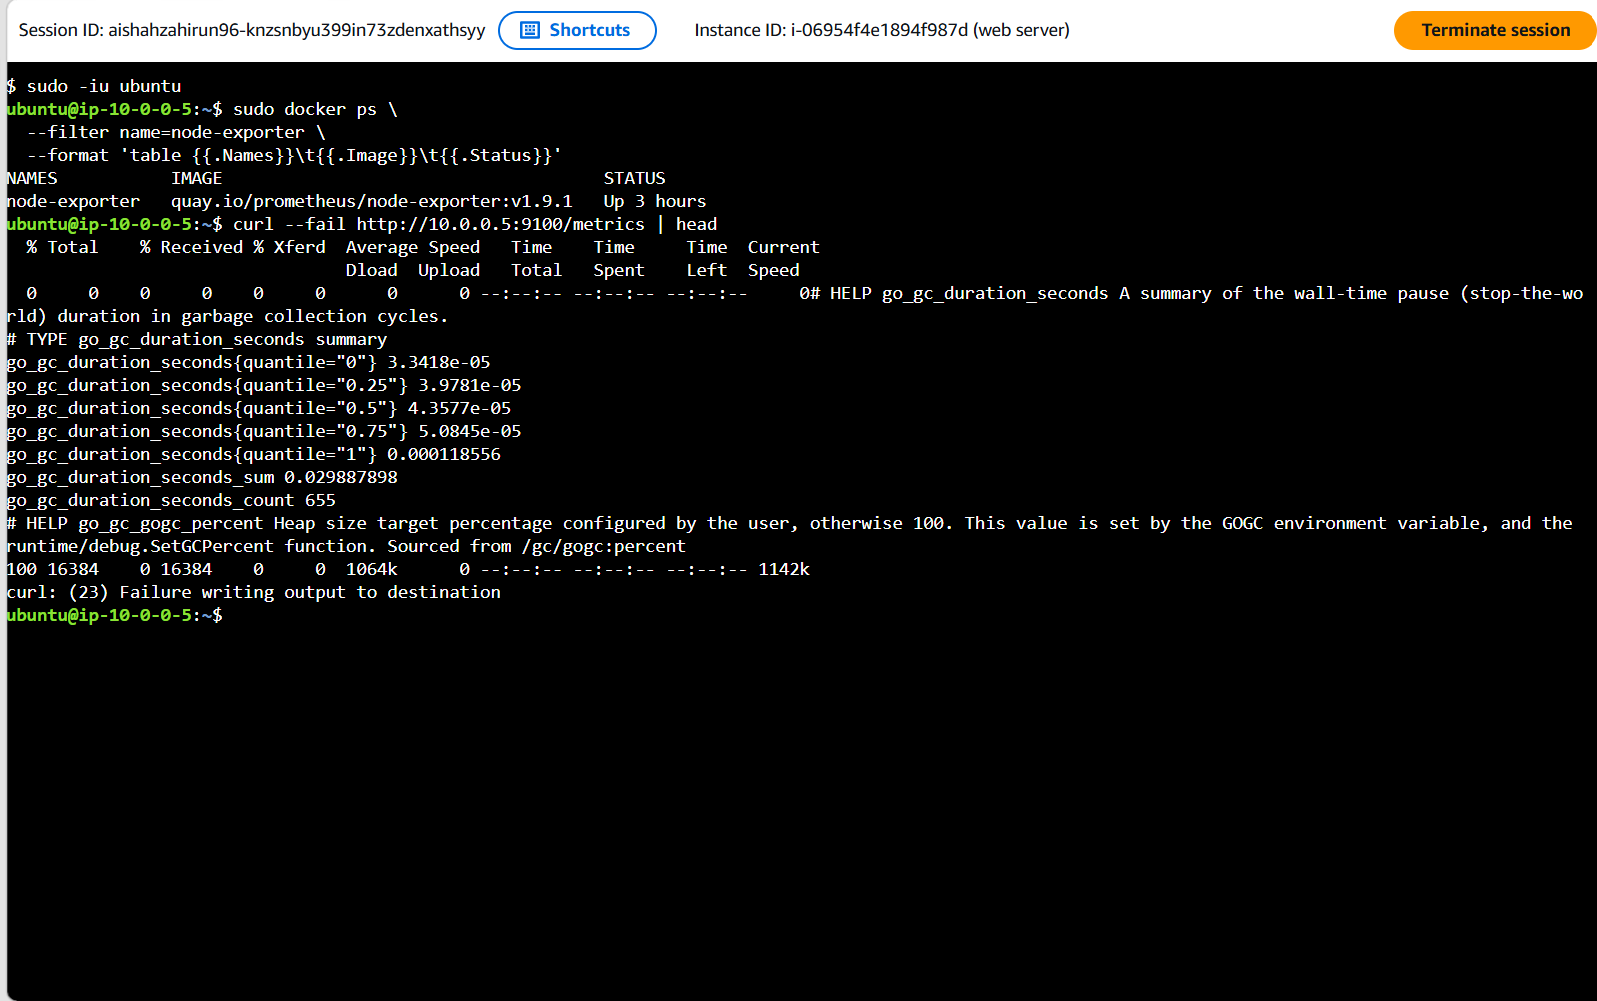
Docker and ECR Evidence
3. Configuration with Ansible
Ansible runs from the controller at 10.0.0.135 and manages:
Web server:        10.0.0.5
Monitoring server: 10.0.0.136
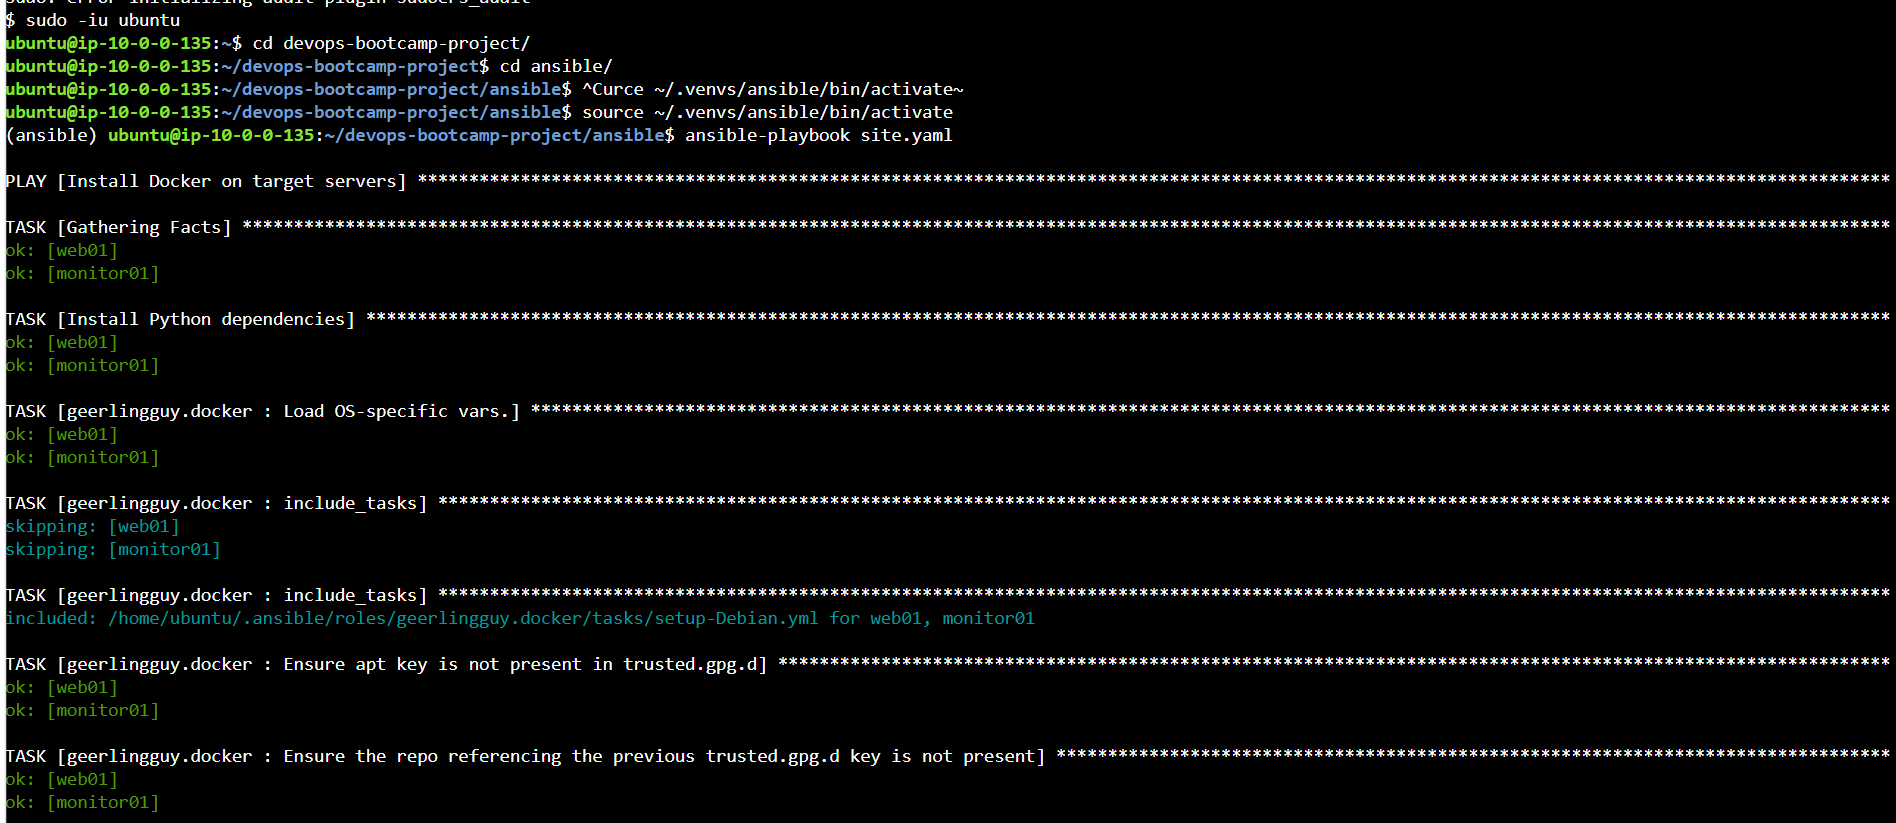
Docker is installed using the Ansible Galaxy role:
geerlingguy.docker
Install Requirements
ansible-galaxy role install -r requirements.yml
ansible-galaxy collection install -r requirements.yml
Test Connectivity
ansible all -m ping
Run All Playbooks
ansible-playbook site.yml
The main playbook runs:
install-docker.yaml
        ↓
deploy-app.yaml
        ↓
deploy-monitoring.yaml
Run the playbook a second time to demonstrate that the configuration is repeatable.
Ansible Evidence

4. Monitoring
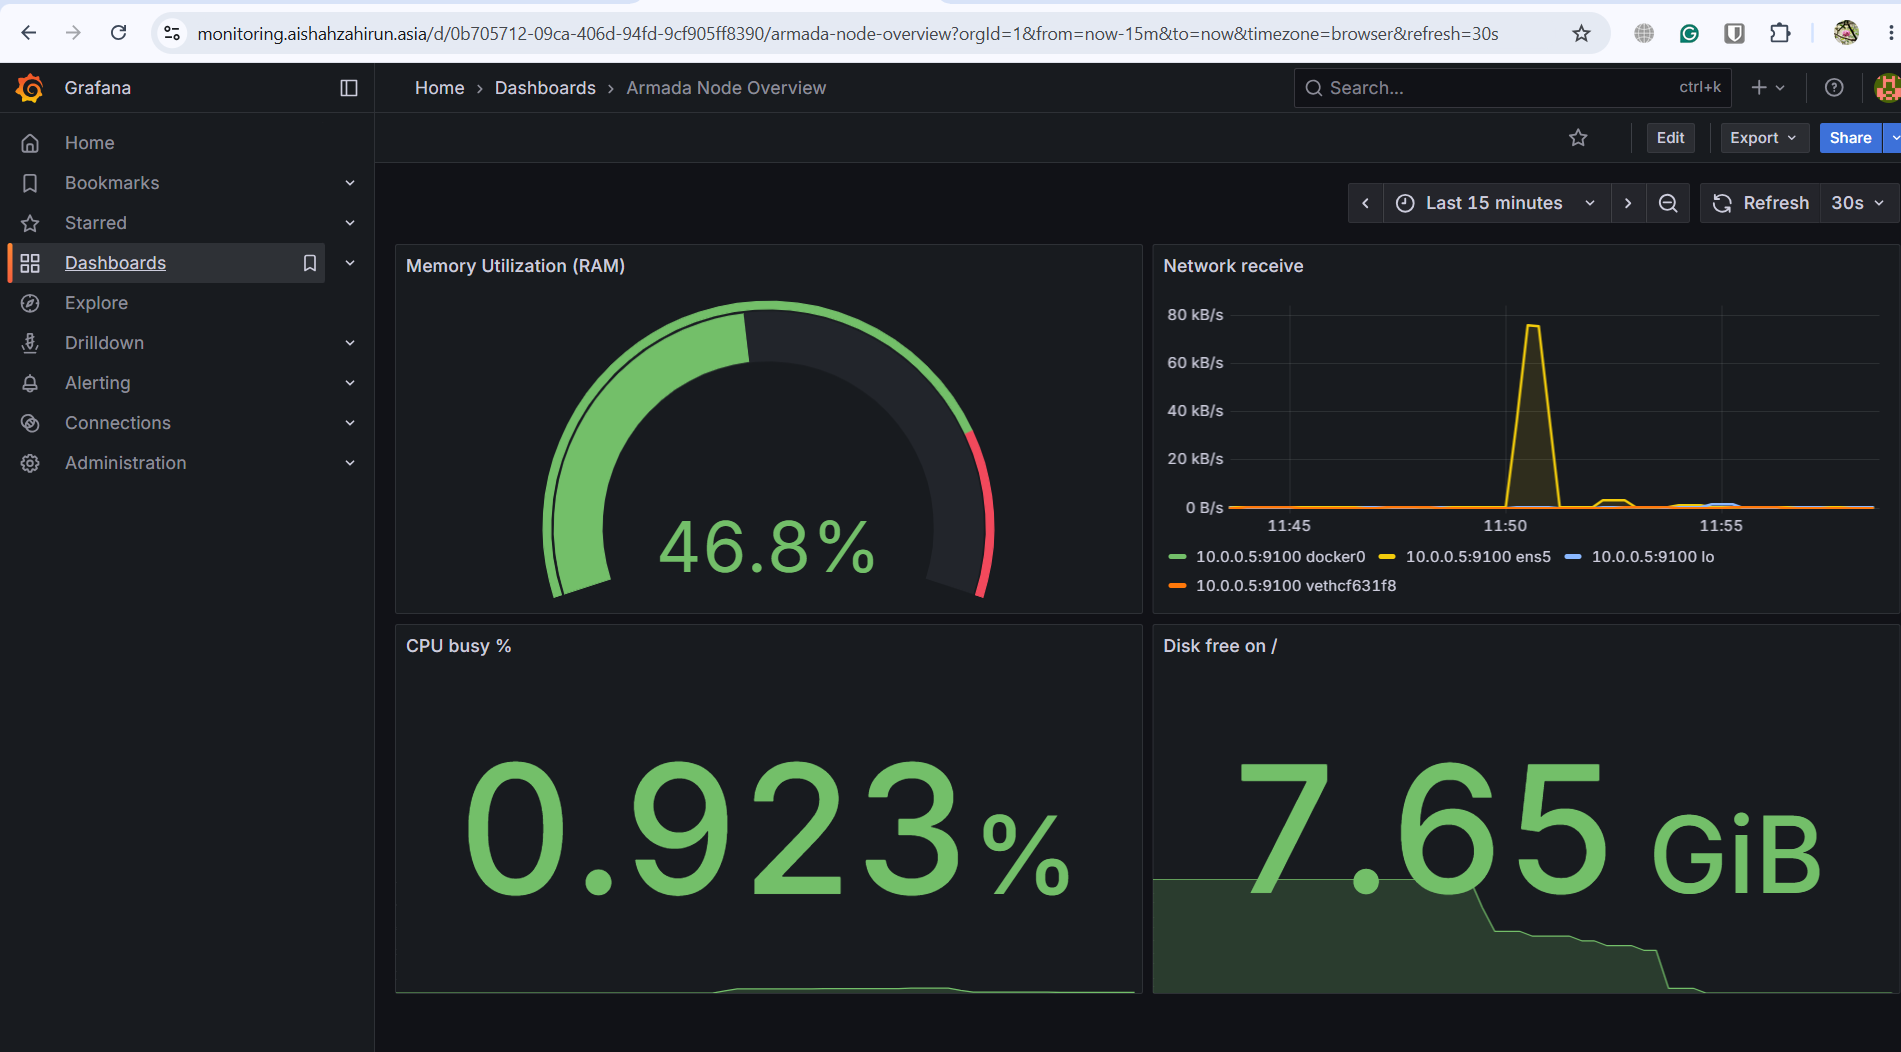
The monitoring stack runs as Docker containers on the monitoring server:
- Prometheus
- Grafana
The web server runs node_exporter on port 9100.
node_exporter → Prometheus → Grafana
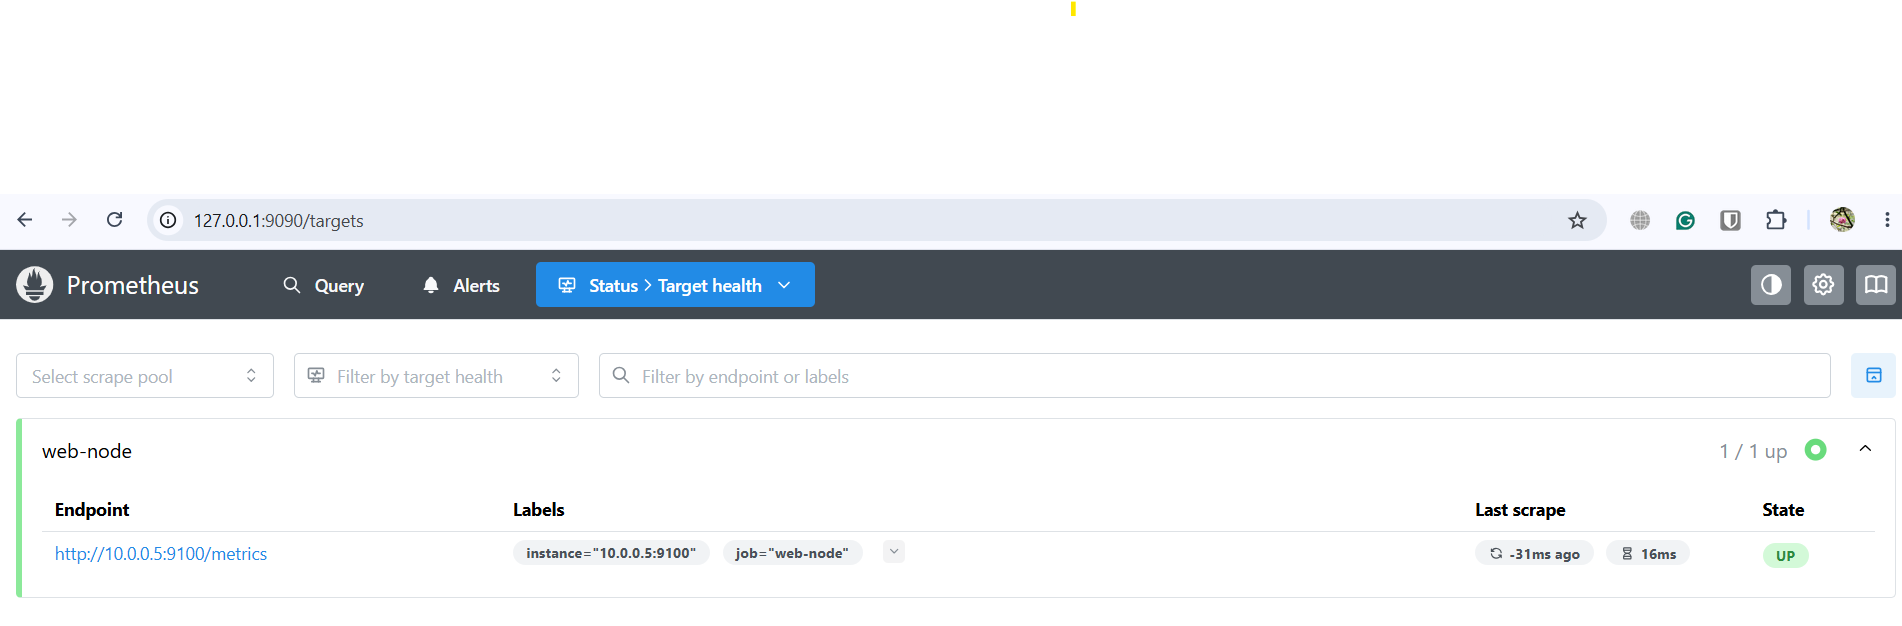
Prometheus scrapes:
10.0.0.5:9100
The security group allows port 9100 only from:
10.0.0.136/32
Storage Configuration
Prometheus uses a bind-mounted configuration file:
/opt/monitoring/prometheus.yaml
    →
/etc/prometheus/prometheus.yaml
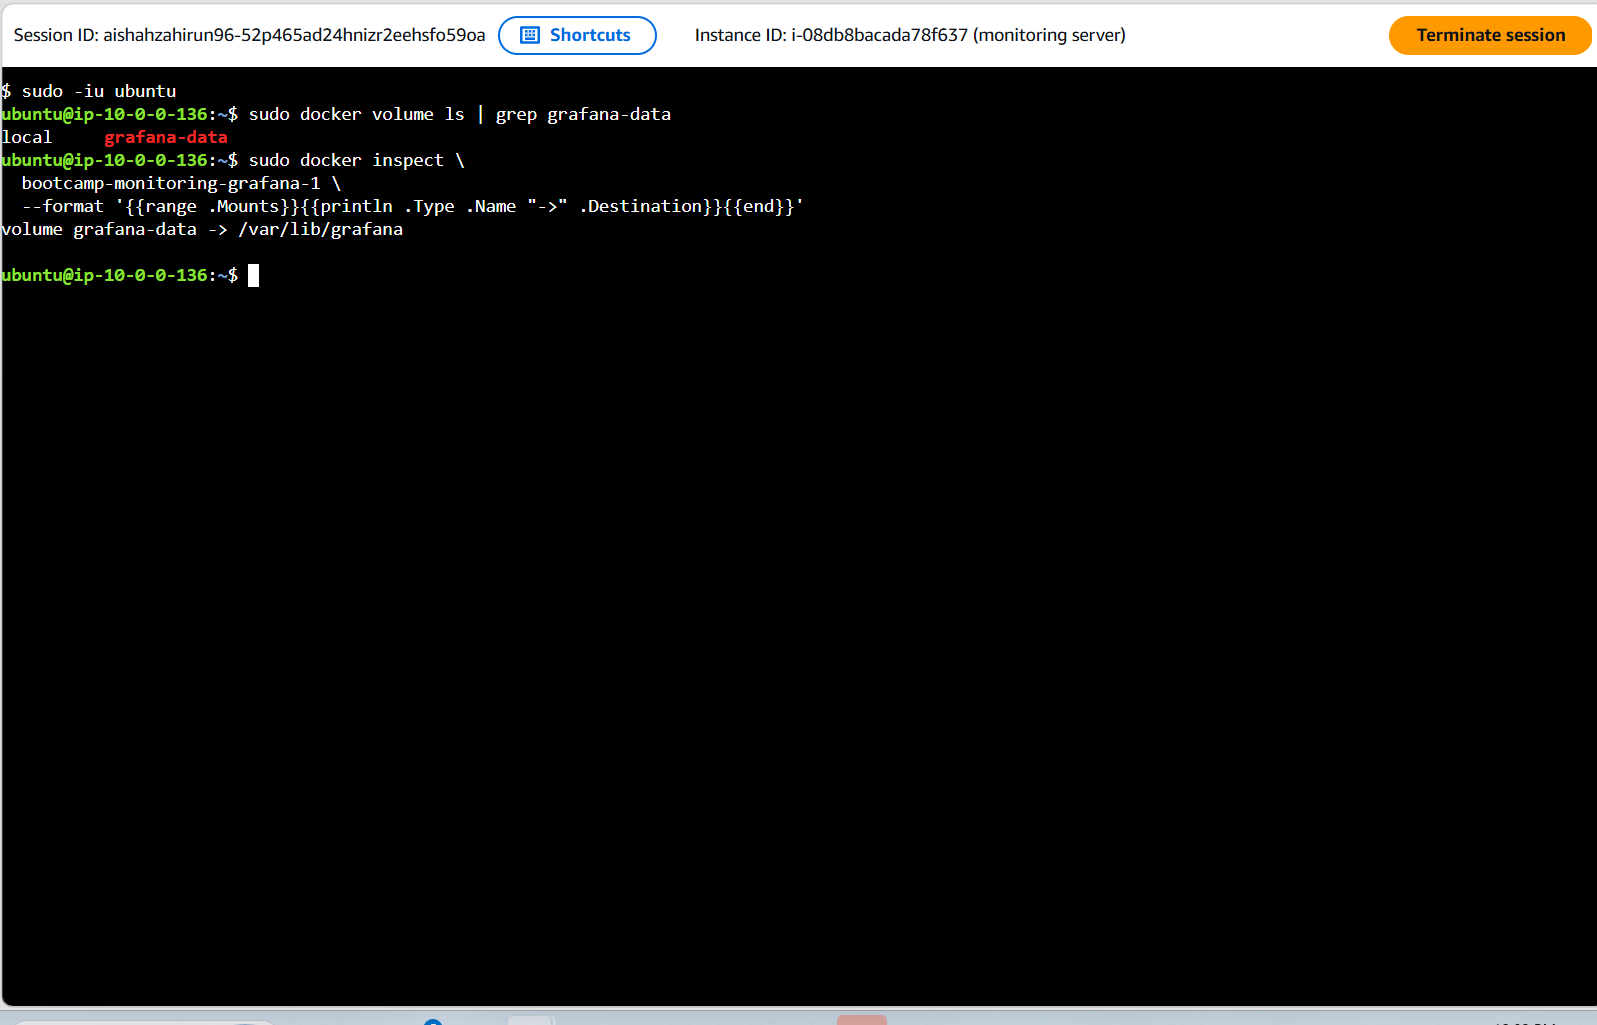
Grafana uses a named Docker volume:
grafana-data
    →
/var/lib/grafana
Verify Containers
sudo docker compose \
  -f /opt/monitoring/compose.yaml \
  ps
Verify Prometheus Target
curl --get \
  --data-urlencode 'query=up{job="web-node"}' \
  http://127.0.0.1:9090/api/v1/query
A result value of 1 confirms that Prometheus can scrape node_exporter.
Monitoring Evidence
5. DNS and Cloudflare
Web Application
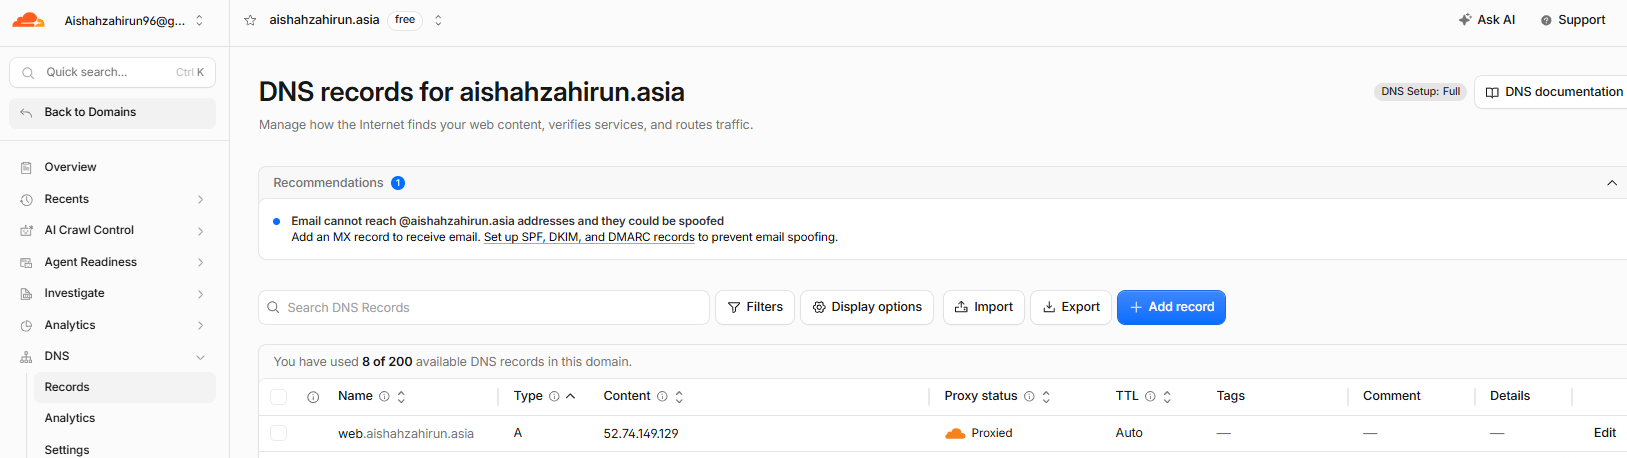
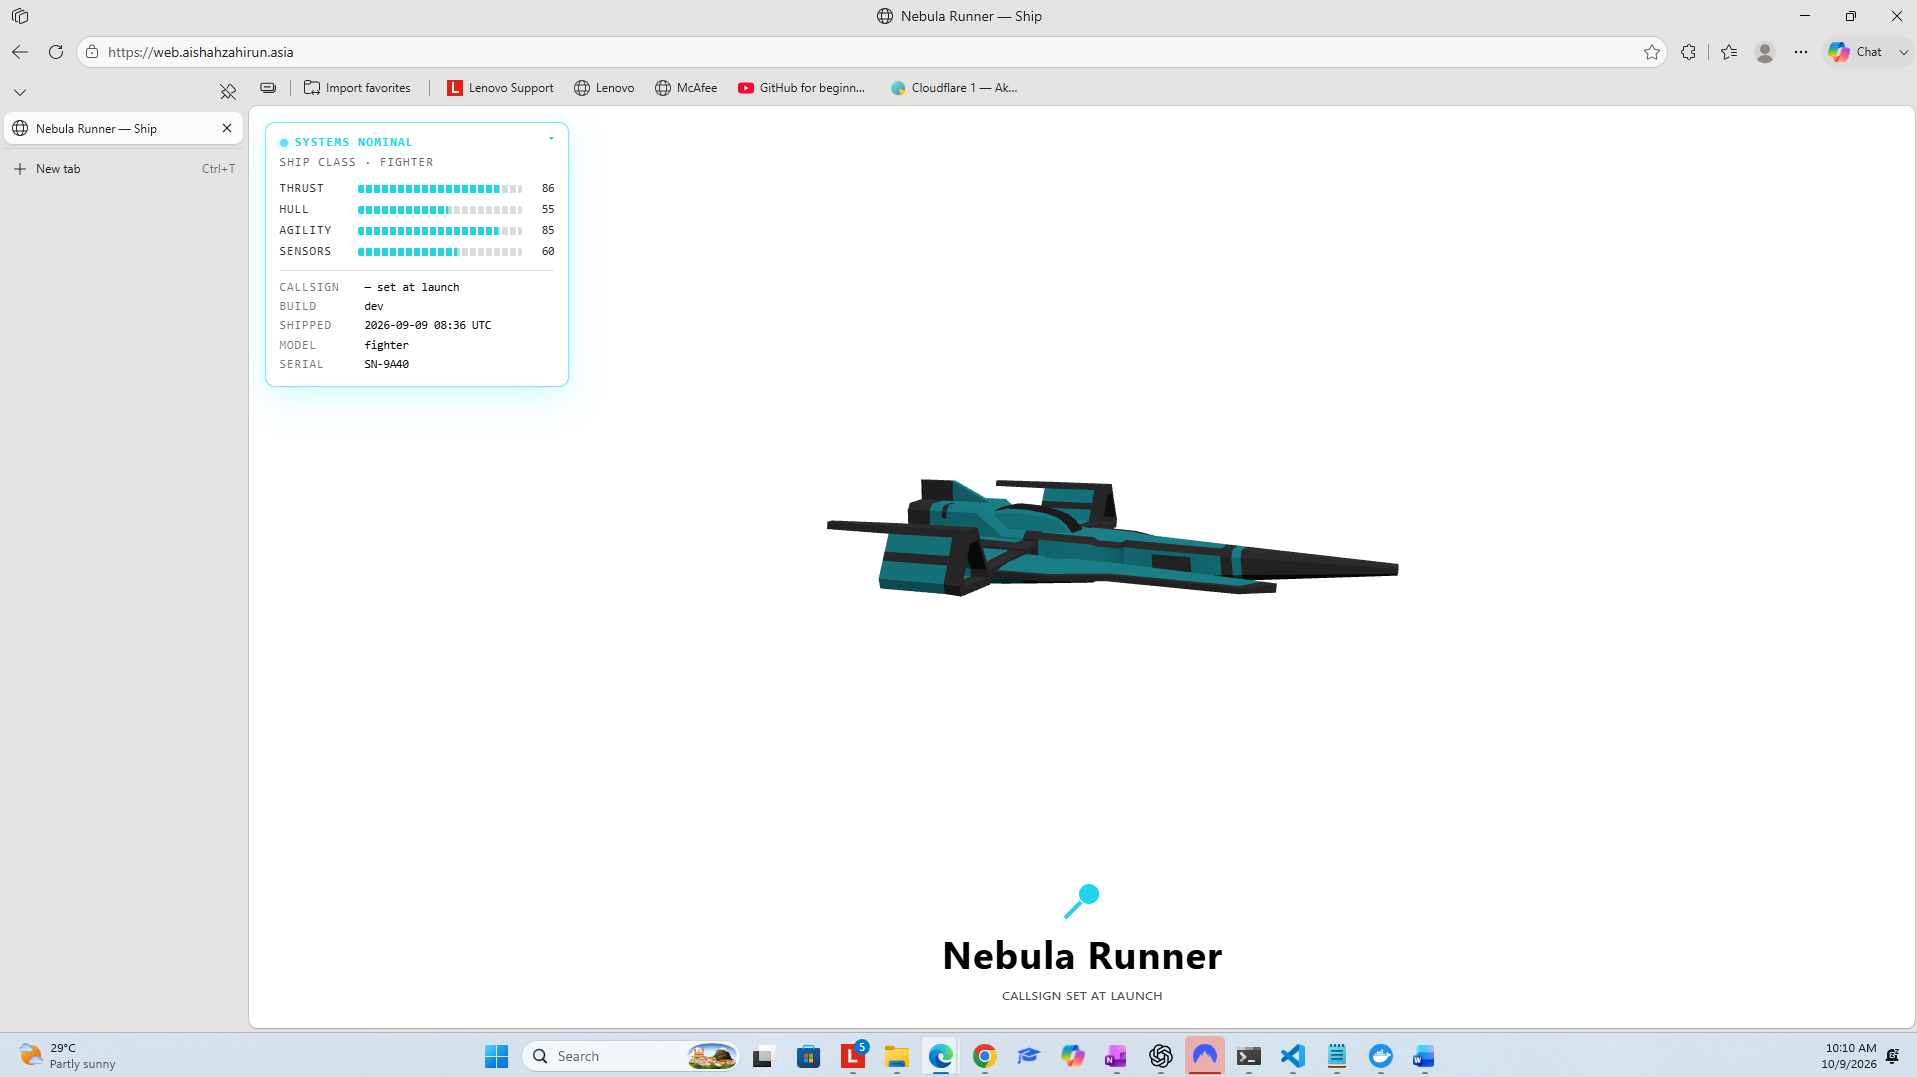
The DNS A record points to the Elastic IP of the web server:
web.aishahzahirun.asia → Web server Elastic IP
Port 80 is open to the Internet through devops-public-sg.
Monitoring
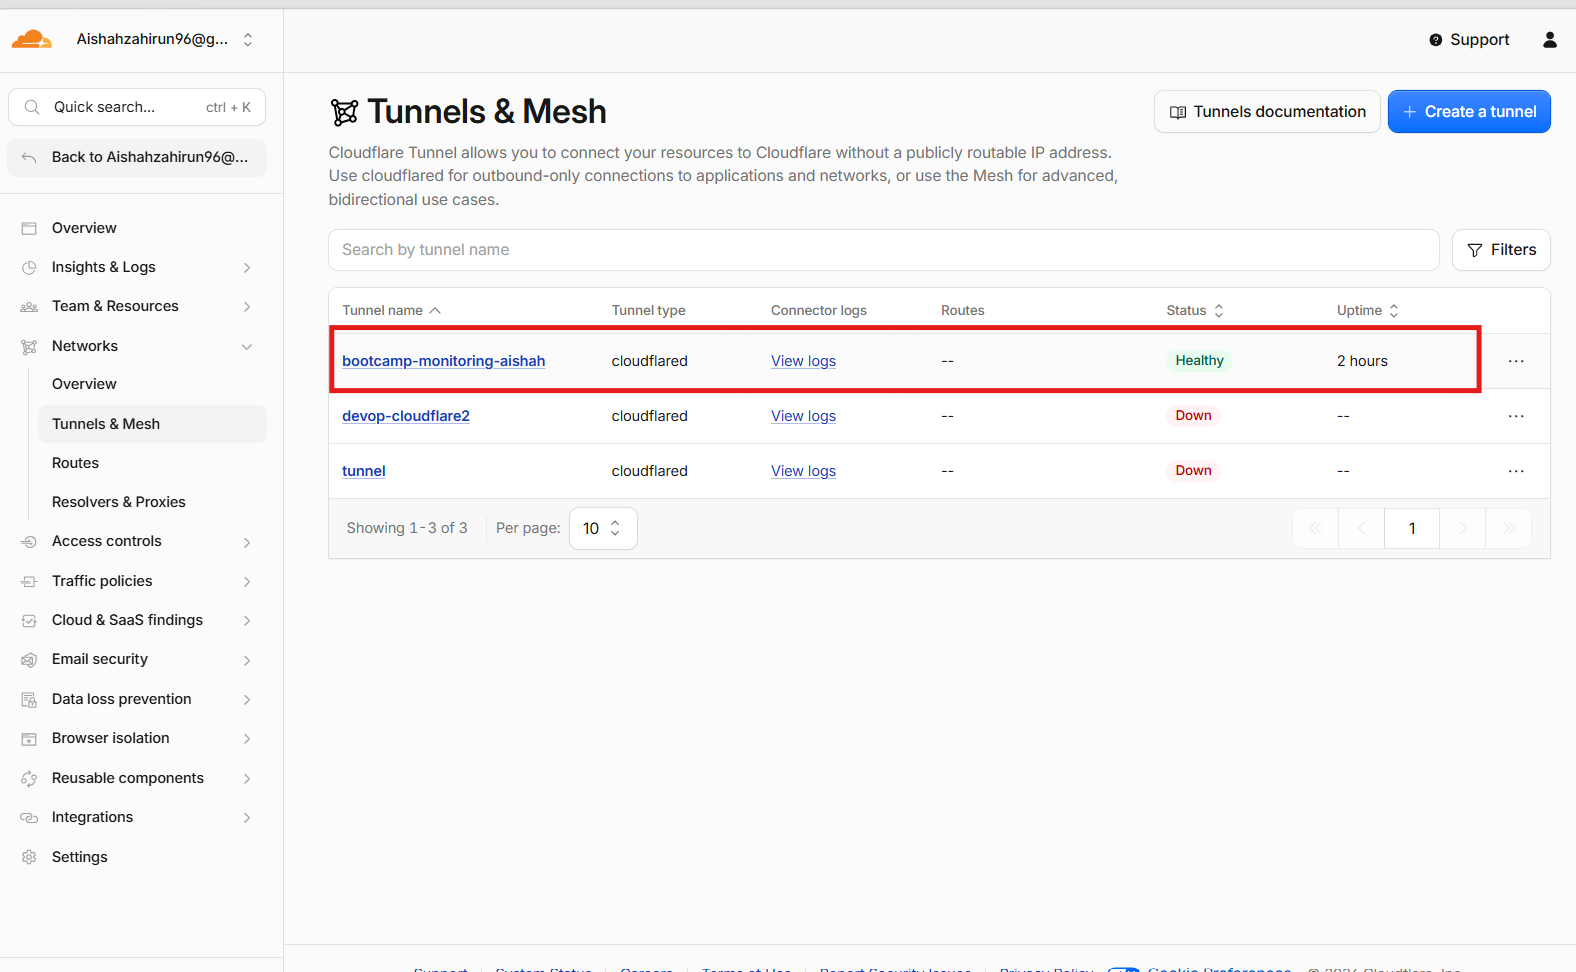
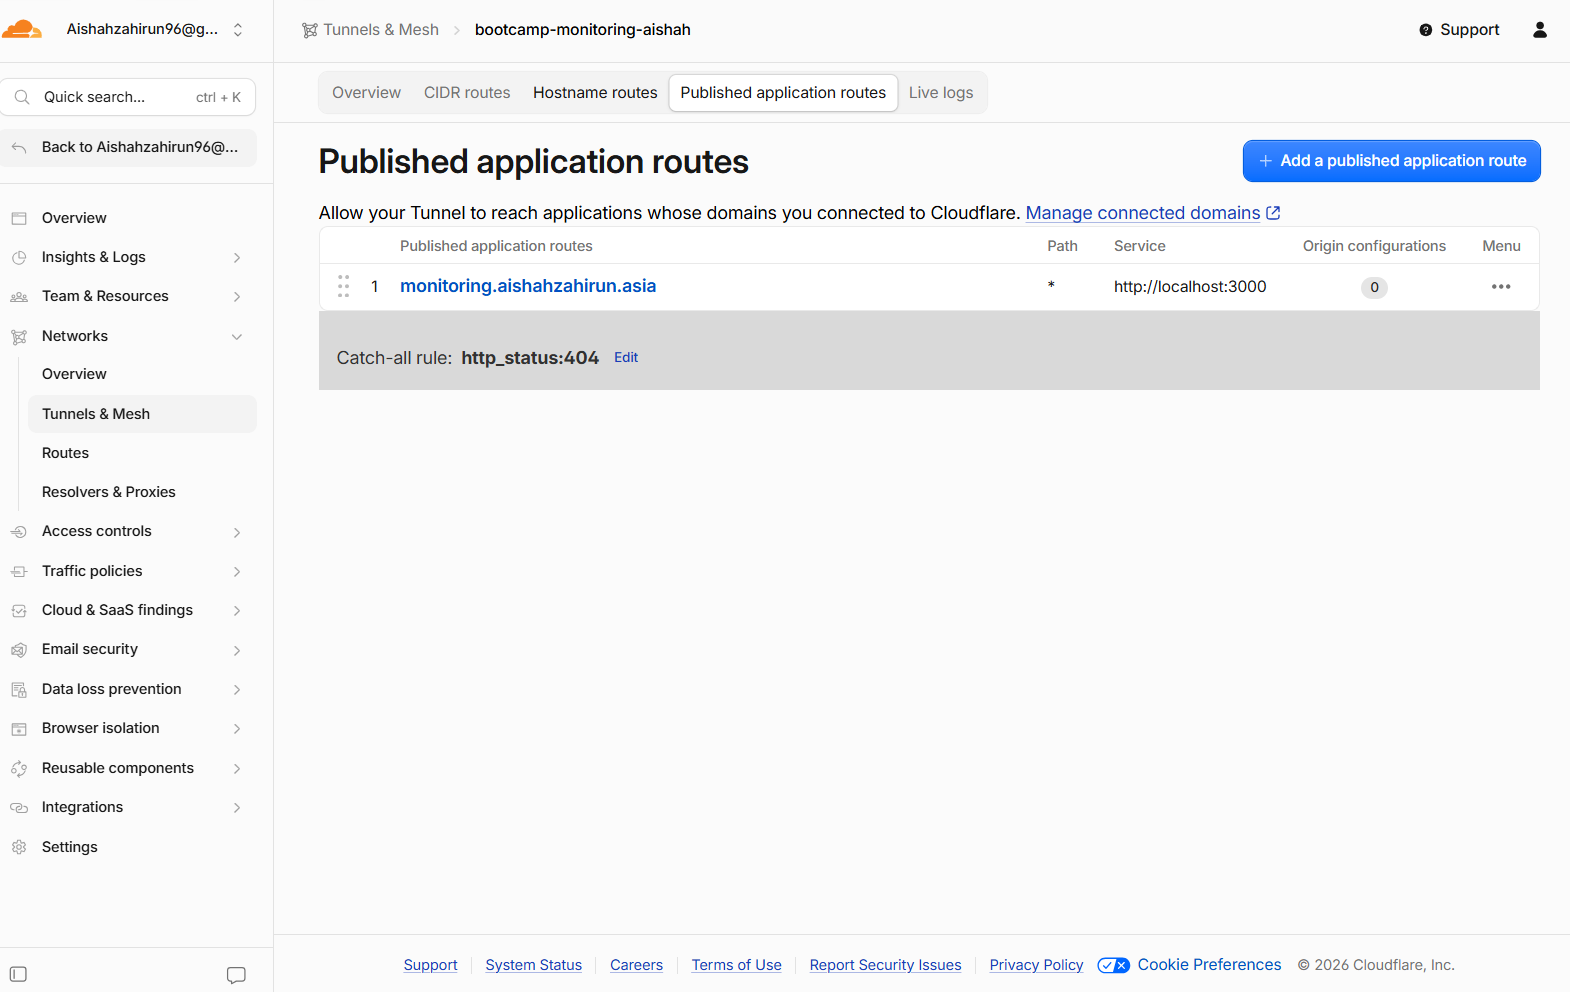
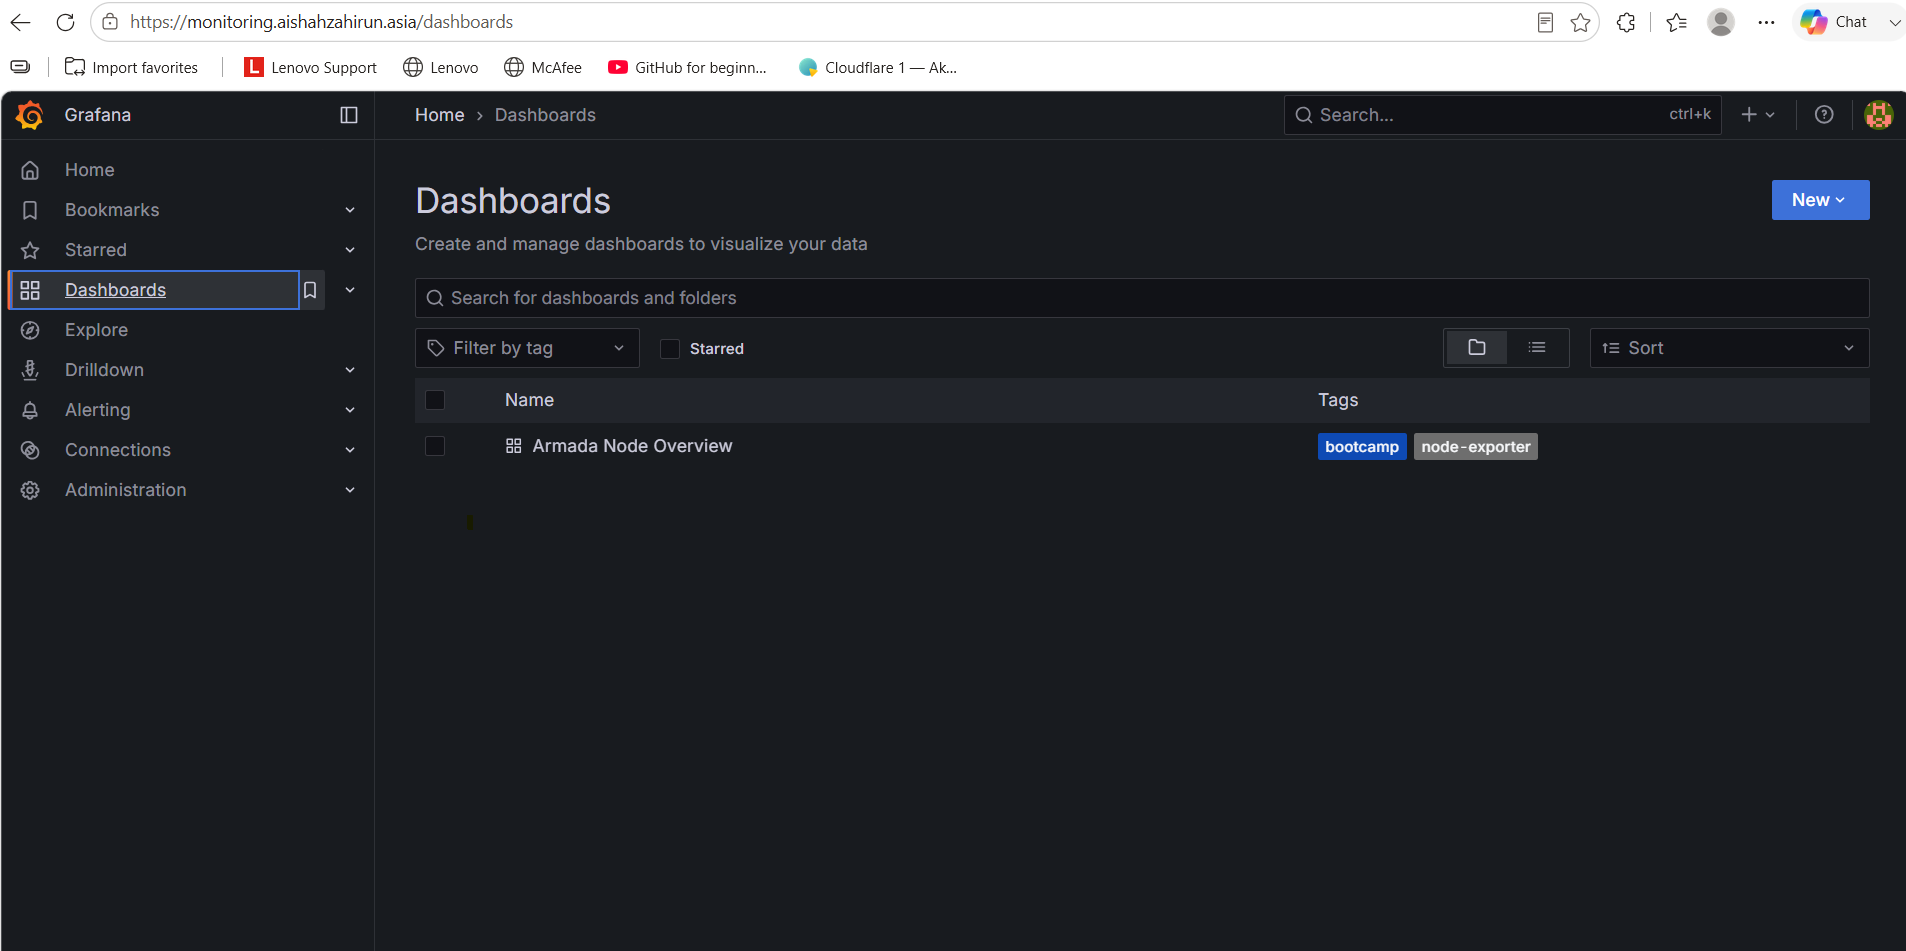
Grafana is published using Cloudflare Tunnel:
monitoring.aishahzahirun.asia
        →
http://localhost:3000
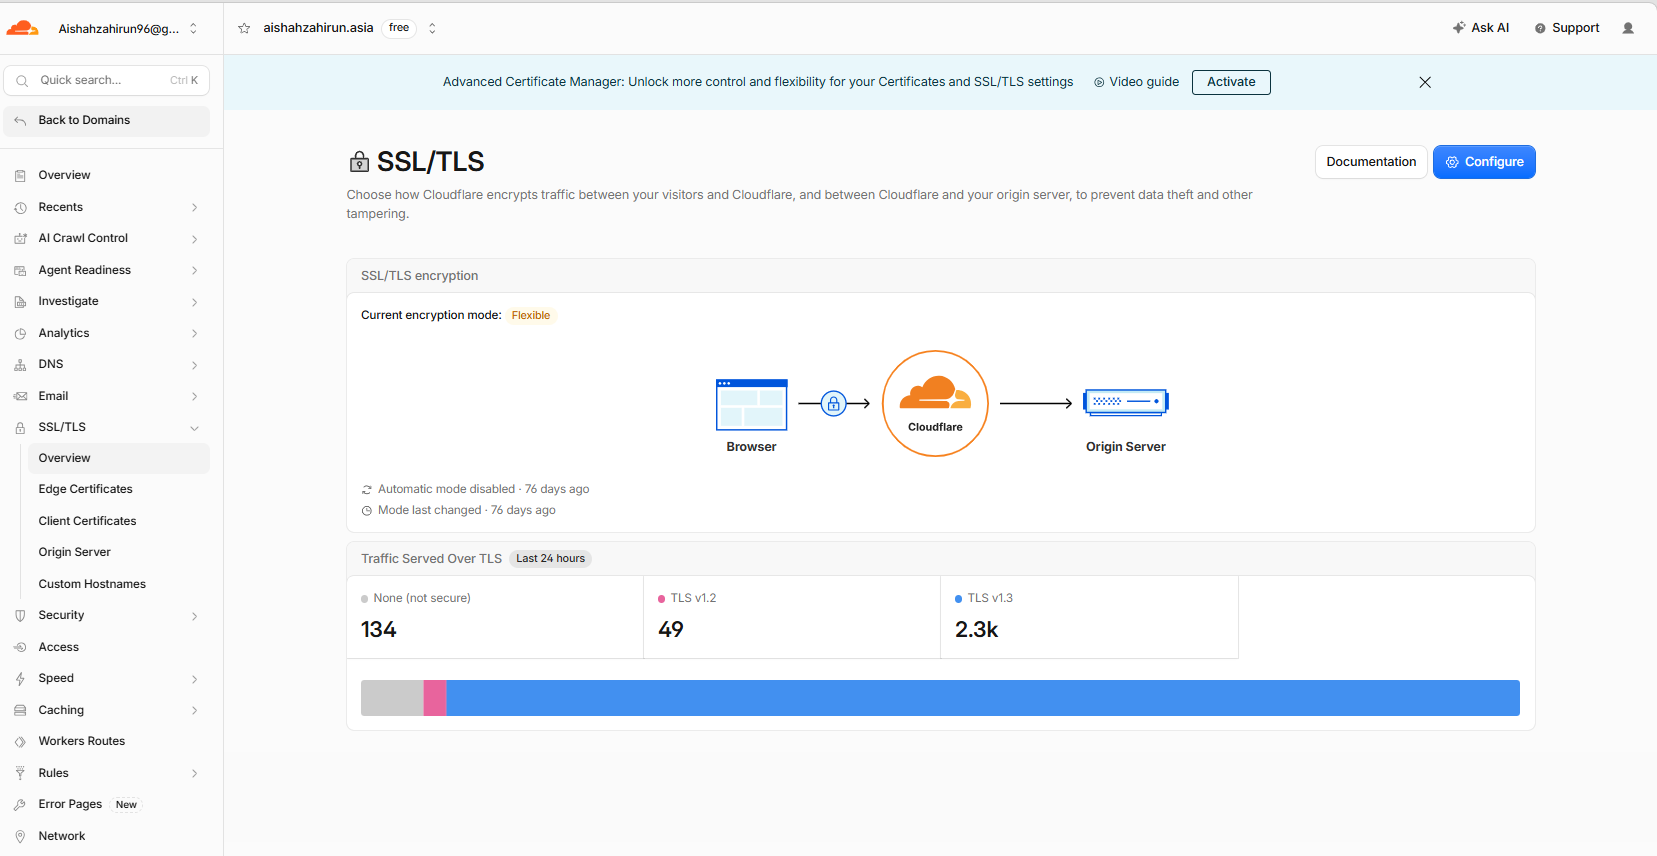
The monitoring server remains in the private subnet and does not require a public inbound port for Grafana.
Cloudflare Evidence
6. GitHub Pages
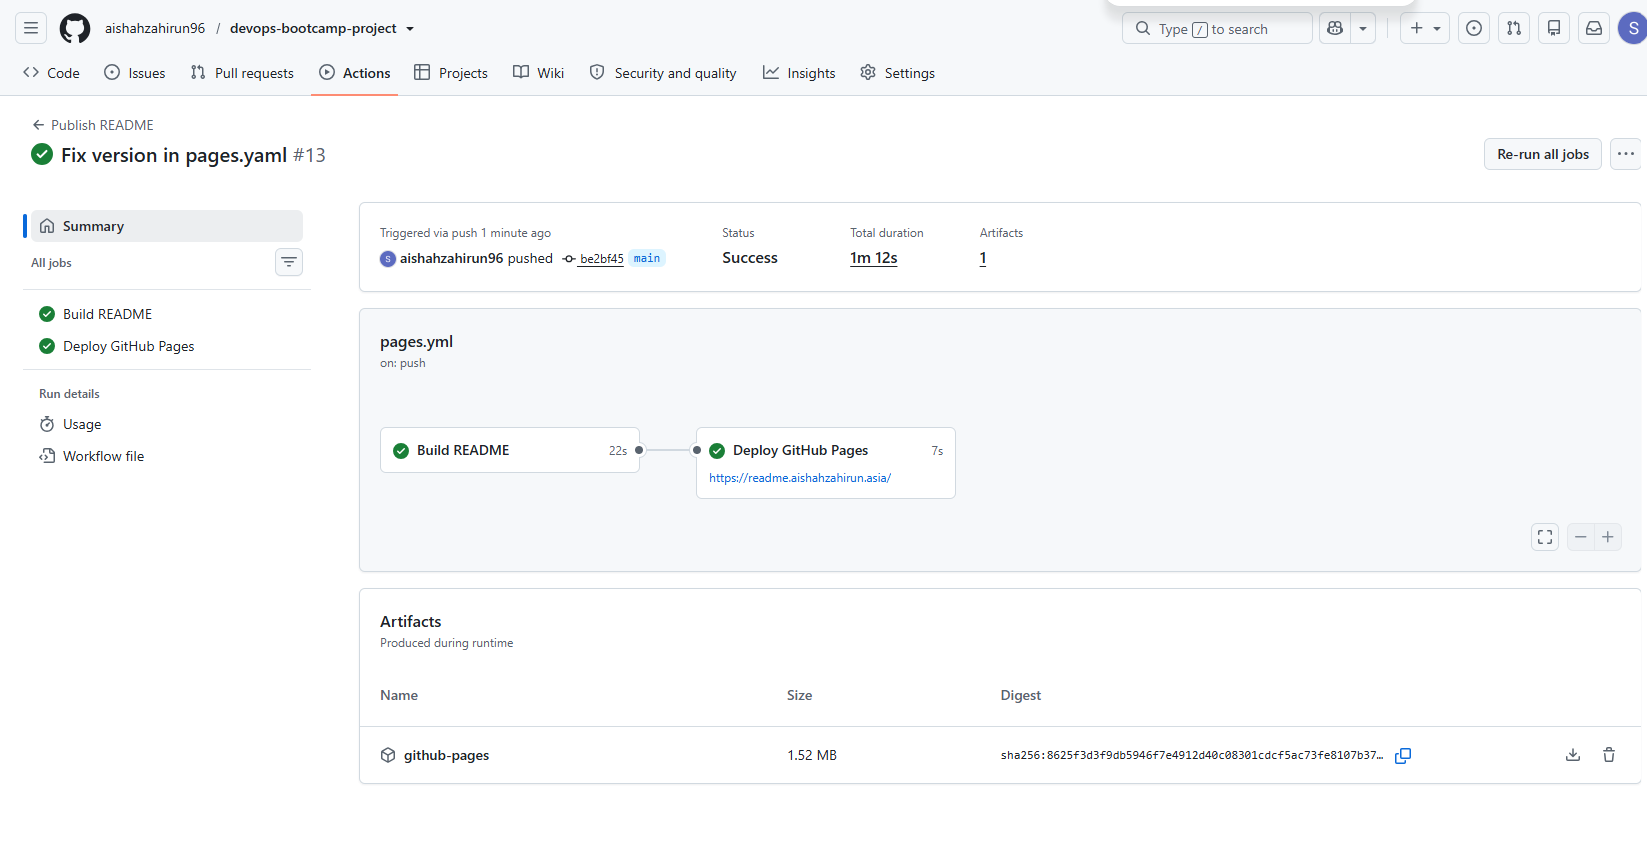
This README is published as a public page using GitHub Actions.
The workflow separates the process into two jobs:
Build README → Deploy GitHub Pages
GitHub Pages URL:
https://aishahzahirun96.github.io/devops-bootcamp-project/
GitHub Pages Evidence
Security Notes
- AWS credentials are not stored in this repository.
- Cloudflare Tunnel tokens are not committed.
- SSH private keys are excluded from Git.
- Terraform state files are excluded from Git.
- Grafana is exposed through Cloudflare Tunnel.
- The monitoring server has no public IP address.
Project Status
| Component | Status |
|---|---|
| Terraform infrastructure | Complete |
| Docker image and ECR | Complete |
| Ansible deployment | Complete |
| Prometheus and Grafana | Complete |
| Cloudflare DNS and Tunnel | Complete |
| GitHub Pages | Complete |